Colston DiBlasi
MATH 401; Mathematics Through 3D printing
November 18, 2019
Data Visualization


 When writing the code to print some struggles that I encountered the majority of my problems. The main problem that I encountered was when trying to figure out how to get the thickness increases. This was a problem because I need to get a base to print it on. When I printed the current water level it took about 3.5 hours. The increased water level only took 1 hour and 15 min. This is what my final prints looked like.


Andros Island
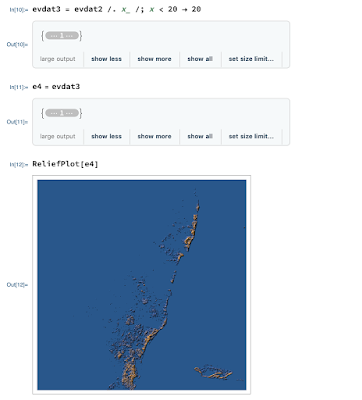
For this assignment I went about it a different way. I used the topographical map of the Bahamas. I was curious if water level rises how does it affect how the Bahamas. At the beginning of the assignment I attempted to do all of the Bahamas. This was a mistake because they are so spread out and some are very small it was hard to see all of the islands. What I ended up doing was just looking at the big island in the Bahamas called Andros Island. I took the topographical graph and I cut off the depth, so the lowest point was 0 which is at sea level. I did this because off of the Bahamas is the Marian Trench which is over 6000 feet deep. Then I decided to look at if current water levels rise then by 2200 the water level would rise about 20 feet. From this information I then made the cut off at 20 feet. This allowed me to see what the Bahamas would look like if the water level was 20 feet higher. I then printed both of these so you could compare how much of Andros Island in the Bahamas would be lost if the water level rose 20 feet.
This is the code for the normal Island:
This is the code for the normal Island:


The codes all the same but then you just change this one line of code. You change 0 -> 0 to 20 -> 20:


No comments:
Post a Comment