Wednesday, November 4, 2015

Tactile graphs for a blind math student

The last few weeks, I have been working with a colleague producing raised graphs for a blind student who is taking a math class, but who has never really been taught the details of plotting.  It has been a very interesting experience learning a few details of how to design such graphs.  So far the student has made excellent progress in understanding, since nobody has ever even tried to show this to him  before! The 3D printer makes for an excellent tool, since it allows relatively quick  of graphs tailored for the class, the student, and the situation. After the first few, it has taken 15-20 minutes to prepare a graph for printing, and around one hour to print.

Below the figures of the tactile plots, I have given the workflow and the details of what has worked and what has not. I'd be very interested to hear from anyone who tries this out!

x^2 compared to x^4
ln(x) compared to exp(x)


The top graph is a  polynomial and the bottom is 1/x
x^3 versus x^(1/3) and sin(x) on two different domains


Technical details: In all cases, my general workflow was as follows:
  • Step 1. Produce  two JPG figures using Matlab: (1) A grid. I used linewidth 4, with a larger size dot at the origin for reference.  (2) A graph of a function. (Note that you could use any method at all of coming up with a graph and follow the next set of steps still.) 
  • Step 2. Convert figures to vector graphics SVG format using the free program Inkscape. 
    Step 1 Grid
    Step 1 Graph of a function

  • Step 3. Open the free program Tinkercad, and add a box approximately 80x80x1 mm.
Step 3 Box in Tinkercad around 80x80x1mm
  • Step 4.  Import the SVG file of the grid into Tinkercad. It needs to fit on the box from the previous step. (In my case this involved shrinking to 8%.) It should be 2-3mm high so that it can be distinguished from the background.
Step 4 add the grid to Tinkercad
  • Step 5. Import the SVG file of the function into Tinkercad. It needs to be exactly the same size as the grid so it matches up, so if you shrink one to 8%, make sure to shrink the other to 8%. However, for the graph, make it 1-1.5mm taller than the grid. At first I made it too tall, and the graph and the grid couldn't be felt simultaneously. 1mm sound small, but think about the thickness of Braille, and it won't seem so mind boggling.
Step 5 Add the graph to Tinkercad but make it 1-1.5mm taller than the grid. 
  • Step 6.  Download for printing, using  file type STL.
  • Step 6 download for 3D printing
  • Step 7. Print on printer, with a raft but without support. It takes around 1 hour to print each. 


Wednesday, October 21, 2015

Tiling the plane


While at GMU, Tyler White worked with me on his senior thesis. He then went on to get a PhD at George Washington University on mathematical questions for certain tilings in the plane. He asked if I could print a set of these three different tiles that appear in his PhD thesis. It looks really cool because though it is two-dimensional, it is a projection of a three-dimensional object, so gives the impression of depth. In fact, this picture above is so misleadingly three-dimensional looking that I had to print another one with my hand in it to make it clear that the shapes really are flat. 


The way I arranged it is boring from a mathematical standpoint, since it is completely uniform. In his thesis, he studied aperiodic tilings using this set of tiles. I've asked him to explain the details. Here's a portion of an aperiodic arrangement: 


Here's the full figure from the PhD thesis: 

Here is Tyler White's full explanation of what this represents:

This tiling is part of an infinite tiling of the plane.  This tiling was originally constructed by Richard Kenyon in his 1996 paper called “The Construction of Self-Similar Tilings” published in the journal of Geometric and Functional Analysis.  This tiling is aperiodic in the sense that if a fixed reference point is chosen, and then the tiling is shifted in any direction, it is impossible to have the exact same tiling you started with.  Kenyon’s goal in the paper was to demonstrate the construction of a self-similar tiling (this tiling is only pseudo self-similar) by using a generalized substitution.  Though the tiling is aperiodic, it is generated in an algorithmic manner by a tiling substitution.  As a result, the tiling as a certain amount of regularity to it.  In fact, for any pattern found in the tiling, there is always another copy of the pattern within a fixed finite distinct (the distance you would have to look depends on the size of the pattern you are looking for), this property is known as bounded gaps.  Former George Mason University undergraduate Mathematics major Tyler White in his 2012 Ph.D. dissertation in Mathematics at George Washington University under the direction of E. Arthur Robinson, Jr. showed that under certain conditions (the shown tiling satisfies these conditions) the tiling is also topologically mixing, which is a stronger type of regularity conditions than the bounded gap property mentioned before.


Monday, October 19, 2015

Coloring Theorems

Yesterday I gave a talk for middle school students at the GMU Math Circle showing that all the countries of the world (or any other round world) can be colored with only four colors (the rule being that no neighboring countries can be the same color.)
Actually, I didn't prove the four color theorem, because as  of yet, nobody has proved the whole thing without computer assistance. 
However I did prove (using only middle school math mind you) that the number of colors needed to color any flat map is not more than five. 
Amazingly, the answer is completely different on Planet Dunkin
on which maps can require at most SEVEN colors. and to illustrate this, I printed out this model of the torus with seven countries, all of which touch each other. 


Torus model  http://www.thingiverse.com/thing:721430 by BonyJordan. (Scaled up for classroom use. Original is half this size.)

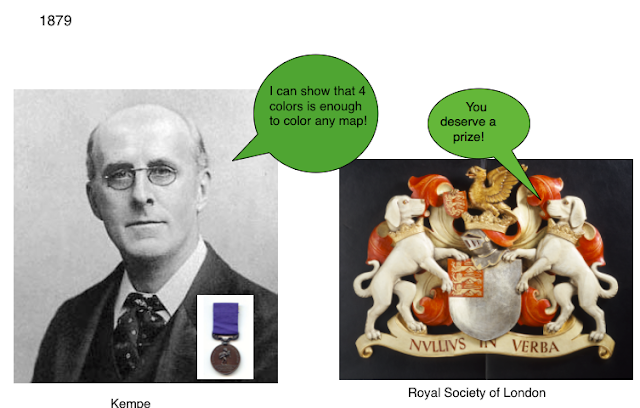
Note this map coloring problem has an interesting history,  which I include from my talk (adapted for web attention span,  meaning I removed 90% of it):


Monday, September 14, 2015

Scanning with an iPhone

I tried out   the iPhone app 123D Catch for 3D scanning. You take many photos of an object from different angles. It uses the phone's accelerometer to know which relative angle you are located at. Here is the scanned image of a banana.

After a fair amount of cleanup of the data in Meshlab,  here is the corresponding 3D printed banana. 


Not as tasty as the original, but regardless a very impressive job. Unfortunately, my experiments with human heads are so far not nearly as successful. (I have yet to scan one that's printable.) 


Thursday, September 10, 2015

Frog Innards

Here's a way to practice before the actual dissection. Practical? I don't know. Seems like it might help to learn the parts prior to having to take them out.

Sunday, July 19, 2015

STEM Camp Poster

As a follow up to the STEM camp for middle school girls, each group of five campers was assigned an  to create a poster about one of the STEM activities in their camp week. They then had to give a formal presentation of their poster to the parents. Here's the poster on 3D printing:


Friday, July 17, 2015

FOCUS STEM Camp

Yesterday was the STEM camp for middle school girls. Everyone seemed to enjoy learning about 3D printing and designing their own print.

Here they are hard at work:


The final products of 16 groups of 5 campers each. The resulting tiles will be made into a mosaic. 

Friday, July 10, 2015

GMU STEM Camp

Working on an activity for a GMU STEM camp for middle school girls next week. This activity is designed to take an hour. The result is a tile. The plan is for each group to make a tile, and the set of tiles will form a camp mosaic. Here are the samples with a penny for scale.

Here are the instructions. (I believe you can view this to see it full size if it isn't readable inline.)

Looking forward to seeing what the campers come up with. 

Wednesday, June 3, 2015

Odyssey of the Mind Trophies


Personalized trophies for the seven members of the Odyssey of the Mind team I coached with Jeff Offutt. Each side is a wordle of lines from the scripts. The print consists of five pieces (four sides and a middle) attached with ABS slurry. Largest production item I've ever made.


Wednesday, May 27, 2015

Funghini

The function
2 x y / (x^2+y^2) 

is discontinuous at (x,y)=(0,0). The graph is a surface of fixed height along each line through the origin - a very hard concept to wrap the mind around. This creates the fold at the middle. Note in the print below that there are four fixed height lines on it in a different color to emphasize this strange fact. The title of this post reflects the fact that the graph looks very much like a specialty pasta, though I am not completely sure Funghini is the right term.


Thursday, May 7, 2015

Calling it a Semester on Multivariable Calculus

This is it for the multivariable calculus 3D print labs. Some students got quite poetic on their final print with names like "Skating Rink," "Guitar Pick," "The Snowcone," and "The Abyss" (The Abyss is not depicted here). Students are mostly enthusiastic about being able to apply the math they are learning (hundreds of years old) to a technology which is less than five years old. The class prints will remain in the department's display case until it runs out of room. 


Thursday, April 30, 2015

Mandatory DIY

The downside of 3D printers is that there aren't any repair shops. When it breaks, a mathematician does hardware.

Monday, April 13, 2015

Level Sets

The level sets of a three-variable function - another class project.


Thursday, April 9, 2015

Mathematical 3D Printing talk

Today I gave a talk about my 3D printing:

Mathematical 3D Printing 

The event was organized by the GMU AWM chapter. Here is a souvenir I made for it:

Visitors and Polyhedra

Today I gave a talk for a few high school students and teachers visiting GMU from a local high school. I wanted to explain how every 3D model is stored as a polyhedron. For example, the simple heart


is stored as an object


consisting of a large number of  vertices  


a large number of edges
 

and a large number of  faces
In particular, even the simple heart has 7852 vertices and 15700 faces!